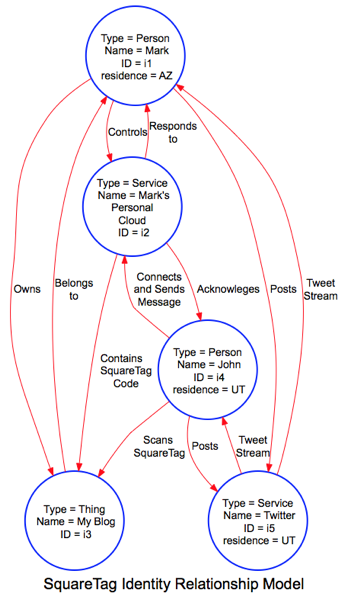
SquareTag Identity Relationship Diagram
Combining my thoughts about my SquareTag Blogtagging experiment and Identity Relationship Diagrams, I created the following diagram, which illustrates my understanding of how the SquareTag system works:

Â
The basic Identities and Relationships are:
- I am a person. Â It starts with me.
- I own a Thing – this blog. It belongs to me.
- I control my Personal Cloud, which is a service hosted by SquareTag. Â It responds to my inputs and sends me messages.
- The Personal Cloud contains a SqareTag code for my blog.
- A person named John visits my blog and scans the SquareTag – a very temporary relationship.
- The action of scanning connects John to my personal cloud and is prompted to send a message to me.
- The Personal Cloud sends a message to me via SMS – including the GPS coordinates of where the scan was made and a text message, which includes John’s Twitter handle.
- I post a message to John on Twitter – another service to which I subscribe.
- John receives my message in the Tweet stream and responds to me.
As I made this diagram, I become aware of a few things I need to refine in the Identity Relationship model.
The graph edges (arrows) are relationships, but I think I have labelled some of them as data flows, rather than relationships. Â I need to come up with a way to differentiate between the relationship and information or messages that are exchanged because of the relationship.
How should fairly static relationship (like blog ownership) be differentiated from transitory relationships (e.g. visiting a blog, scanning a SquareTag)?
Should a Personal Cloud be divided into a Subject and a Service?  Johannes Ernst’s recent post would perhaps infer that.  Perhaps the Subject is “what it is” or “what is does”; the Service is “how I access and control it.”Â
The diagramming software I use, Graphvis, has some decided advantages and disadvantages. Â Because it is data driven, I don’t have to keep re-drawing the diagram by hand. Â However, I don’t have much control over the esthetics of the diagram.
If anyone has any feedback, I’d be happy to hear it.
Â
